RESEARCH & DESIGN PROCESS
The overall idea for this project came from my interest in fashion, and a curiosity about what drives people to dress up? What does dressing up even mean to most people?
The process of this visualisation began with data collection - I spent 2 to 3 weeks collecting data along Orchard Road, each time refining my process.
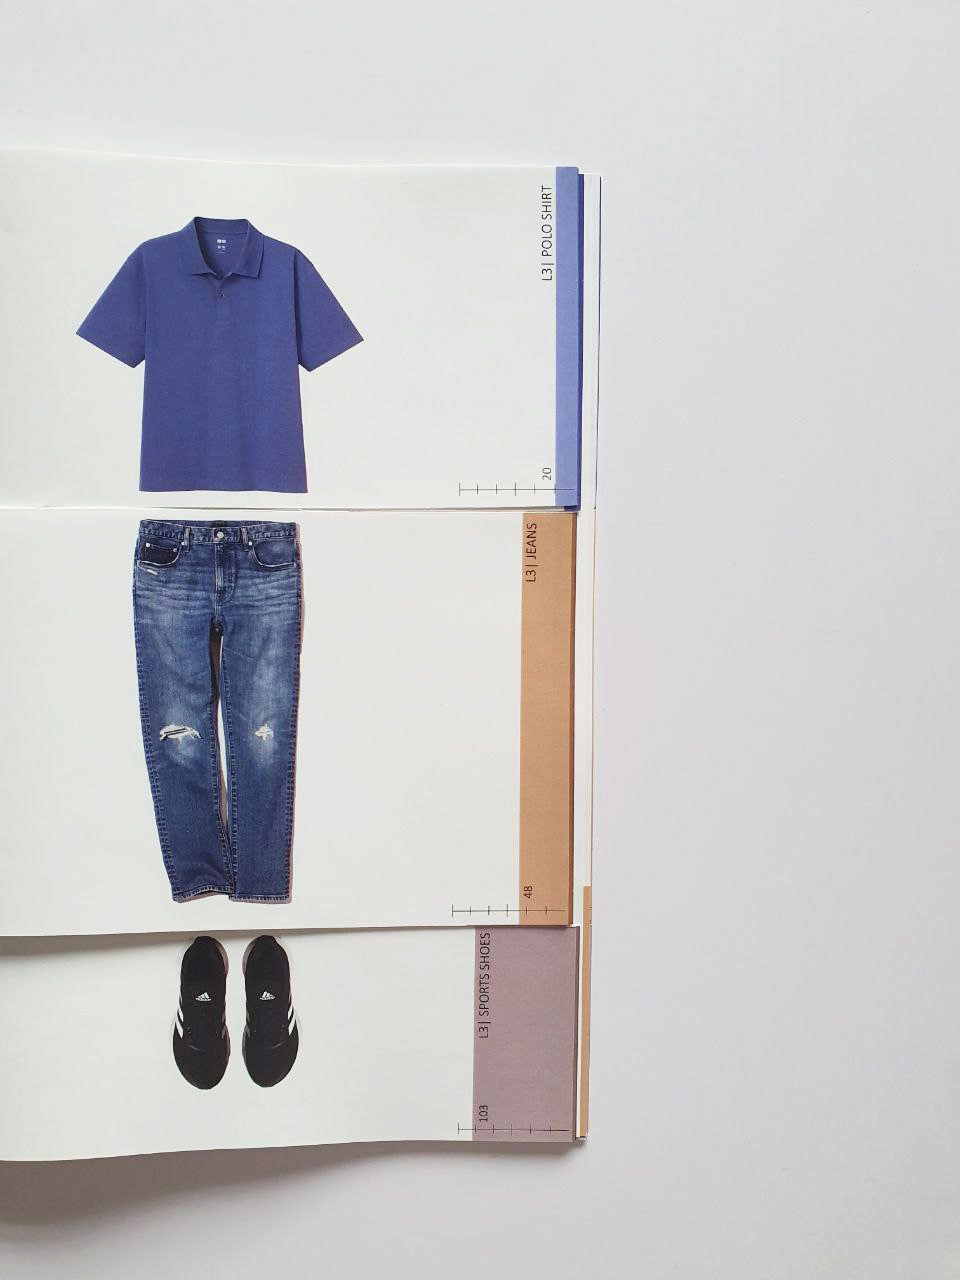
With the data collected and an idea of the intended final outcome, I combed through the data to rank all the individual clothing items, then outfits, and catergorised the combinations in order to form a few different types of data groups.
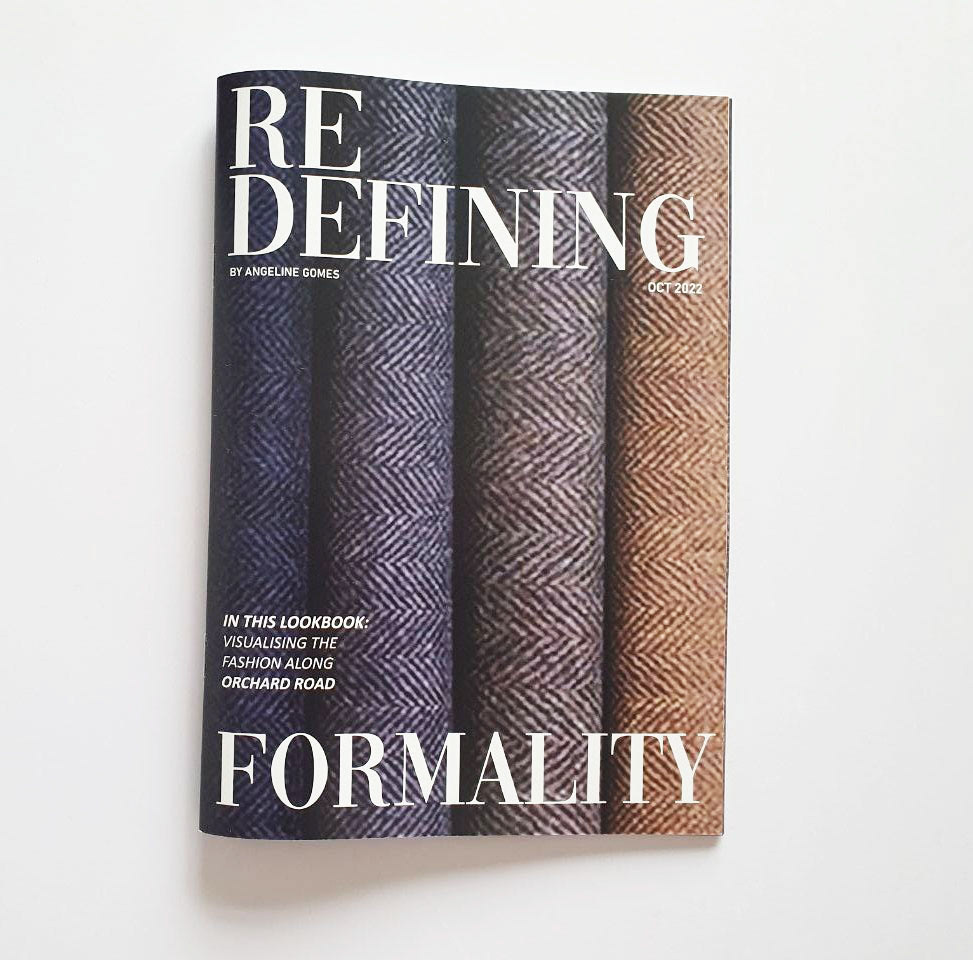
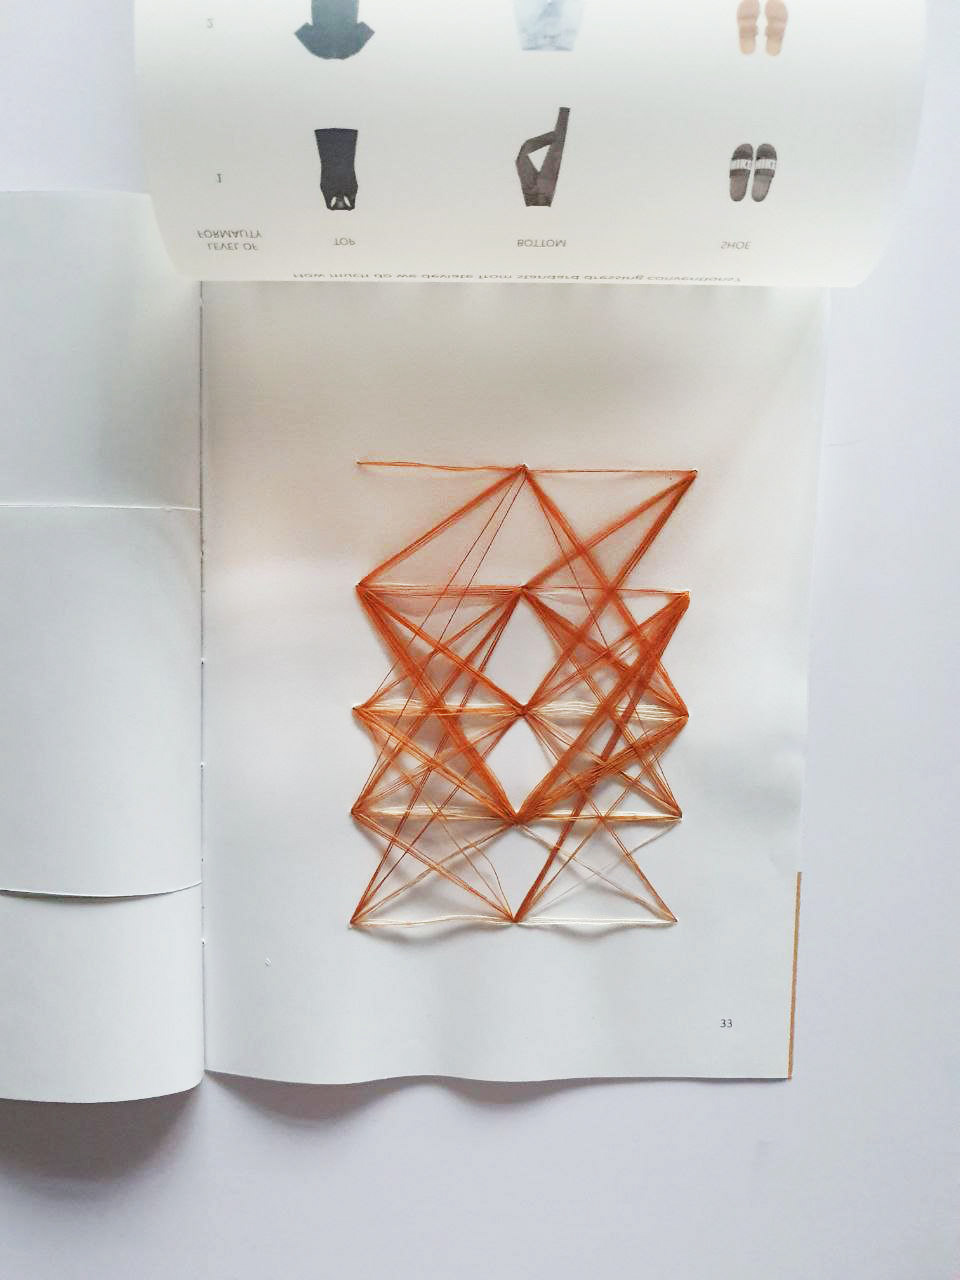
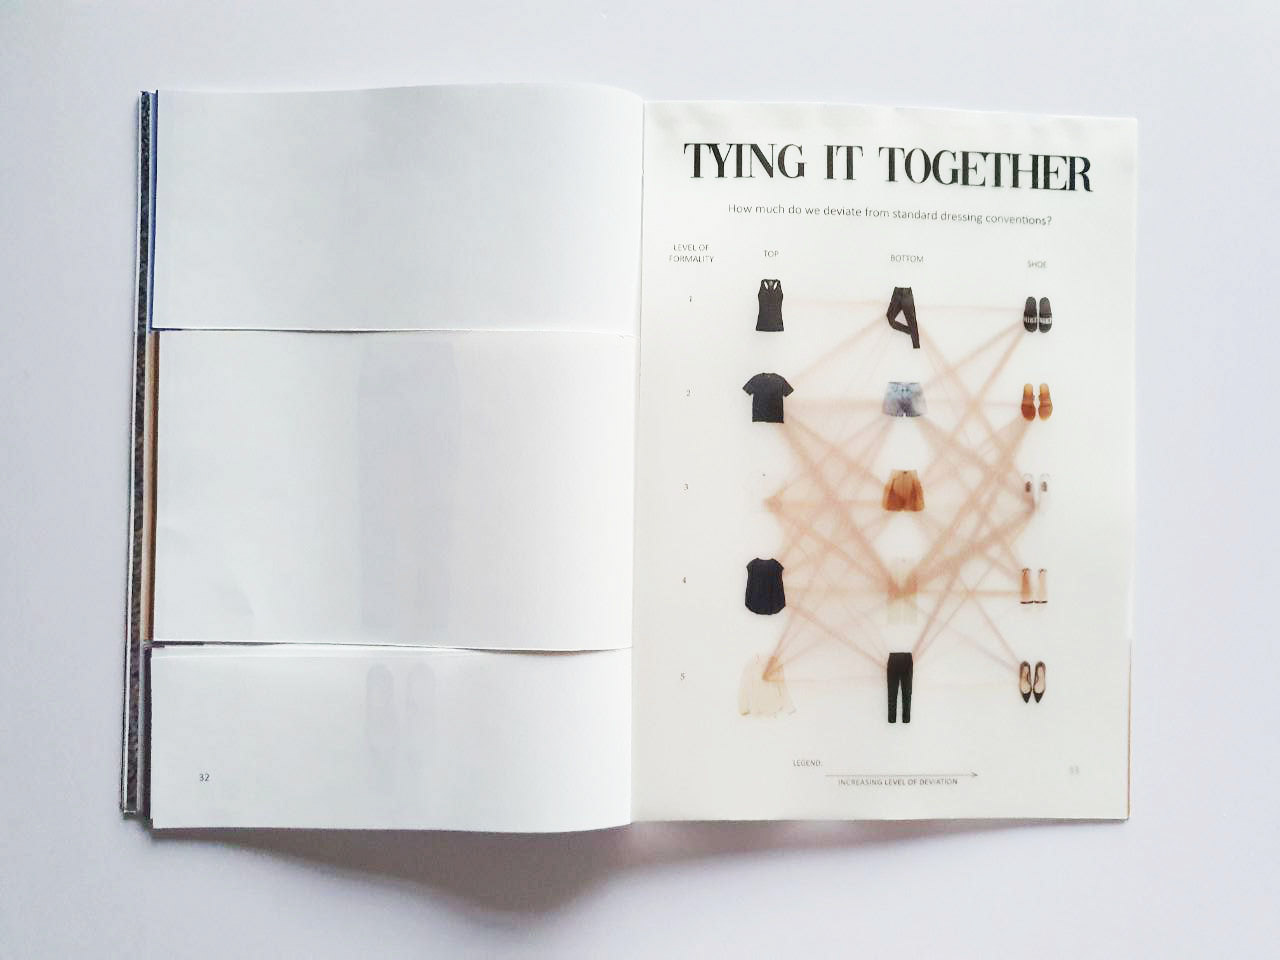
Visualisation was the most fun! Putting my different ideas into tables, graphs and eventually creative and interactive forms like the thread map and information tabs on the clothing 'catalogue' took a few iterations and was very rewarding.
